If you landed here searching for a body fat percentage chart, you’re in the right place. First, we’ll translate what the classic ranges actually mean for men and women. Next, we’ll unpack visceral fat—the deeper belly fat that predicts health better than your scale weight—and show a quick waist-to-height risk check. Then, you’ll learn RFM, an at-home body-fat estimator that requires only a tape measure. Finally, we’ll convert numbers into action with a simple, sustainable plan.
When you’re ready to move from theory to practice, compare your estimate in the Army Body Fat Standards & Calculator, set a realistic target using the RMR Calculator, and plan day-to-day food with Macro Master—so everything you need lives on MasalaMonk.
Body Fat Percentage Chart for Men: What the Categories Actually Mean
Understanding where you sit on a body fat percentage chart helps you choose the next sensible step—trim the waist, maintain performance, or simply track trends more consistently. Treat these ranges as a guide, not a verdict. They mirror widely used norms from coaching and university sources, including the ACE chart and Stony Brook University’s table (PDF).
Men (Body Fat % categories)
- Essential: 2–5%
- Athletes: 6–13%
- Fitness: 14–17%
- Average: 18–24%
- Obese: ≥25%
Moreover, read these numbers alongside your waist-to-height ratio (WHtR). A straightforward NHS rule is to keep your waist less than half your height—see the NHS WHtR calculator. For a second estimate beyond the chart, run RFM (details below) or compare with the U.S. Army/Navy tape method in our Army Body Fat Standards & Calculator. To reduce noise, be consistent: same time of day, similar hydration, same device or method.
Interpreting Men’s Categories with Context
However, body-fat ranges do not exist in a vacuum. Age, training history, sleep, hormones, and fat distribution all matter. For instance, a runner at 17% with a small waist can be metabolically healthier than a heavier lifter at 15% who carries most fat centrally. Consequently, pair the body fat percentage chart with WHtR and habits over time. If both trend the right direction across weeks—not days—you’re likely improving.
Body Fat Percentage Chart for Women: Healthy Ranges and Practical Reading
Women’s healthy ranges are naturally higher because essential fat, hormone balance, and reproductive function require it. Use these categories as a compass; your energy, cycle regularity, performance, and waist trend complete the picture. For reference, see the ACE chart and Stony Brook PDF.
Women (Body Fat % categories)
- Essential: 10–13%
- Athletes: 14–20%
- Fitness: 21–24%
- Average: 25–31%
- Obese: ≥32%
Additionally, because belly fat signals risk more strongly than total fat alone, pair your percentage with WHtR using the NHS calculator. Furthermore, NICE classifies central adiposity with WHtR bands for clinical decision-making (NICE NG246 bands).
Women’s Chart in Real Life: What Else Matters
Notably, menstrual phase, stress, and sodium can shift daily readings. Likewise, hydration status can change BIA scale estimates within hours. Therefore, evaluate progress weekly or fortnightly, not day-to-day. Meanwhile, keep training quality high; resistance work supports lean mass so your body composition improves even when scale weight changes slowly.
How to Use a Body Fat Percentage Chart Without Overthinking
Use the chart as a compass, not a courtroom. The labels—essential, athletes, fitness, average, obese—describe population ranges. Your best zone depends on age, training age, sleep quality, and—especially—where you store fat.
Because visceral fat carries more risk than total fat alone, add one quick check: waist < 0.5 × height via the NHS WHtR calculator. Clinically, NICE bands WHtR roughly as 0.40–0.49 healthy, 0.50–0.59 increased, and ≥0.60 high central adiposity (NICE NG246). Moreover, NICE publicly reinforces the “keep your waist less than half your height” message (NICE news).
South Asian Cut-Offs and Why They Matter
If you’re South Asian, risk often appears at smaller waists. Practical action lines used across the region—and summarized in peer-reviewed literature—are ≈90 cm for men and ≈80 cm for women. Start with the consensus review Obesity in South and Southeast Asia—A New Consensus; supportive material appears in Endocrinology & Metabolism and this URMC review PDF. Also, BMI doesn’t measure fat directly; for a plain-English refresher, read Cleveland Clinic’s BMI explainer and then return to the chart and your waist.
Progress Signals to Trust (and No, It’s Not Daily Weight)
Even so, judge momentum by weeks, not days. Hydration, sodium, stress, sleep, and menstrual phase can swing daily numbers. Consequently, aim for a calm, downward trend in waist and percentage, and a steady or improved training log. Ultimately, you want behaviors that are sustainable when life gets messy—because life always gets messy.
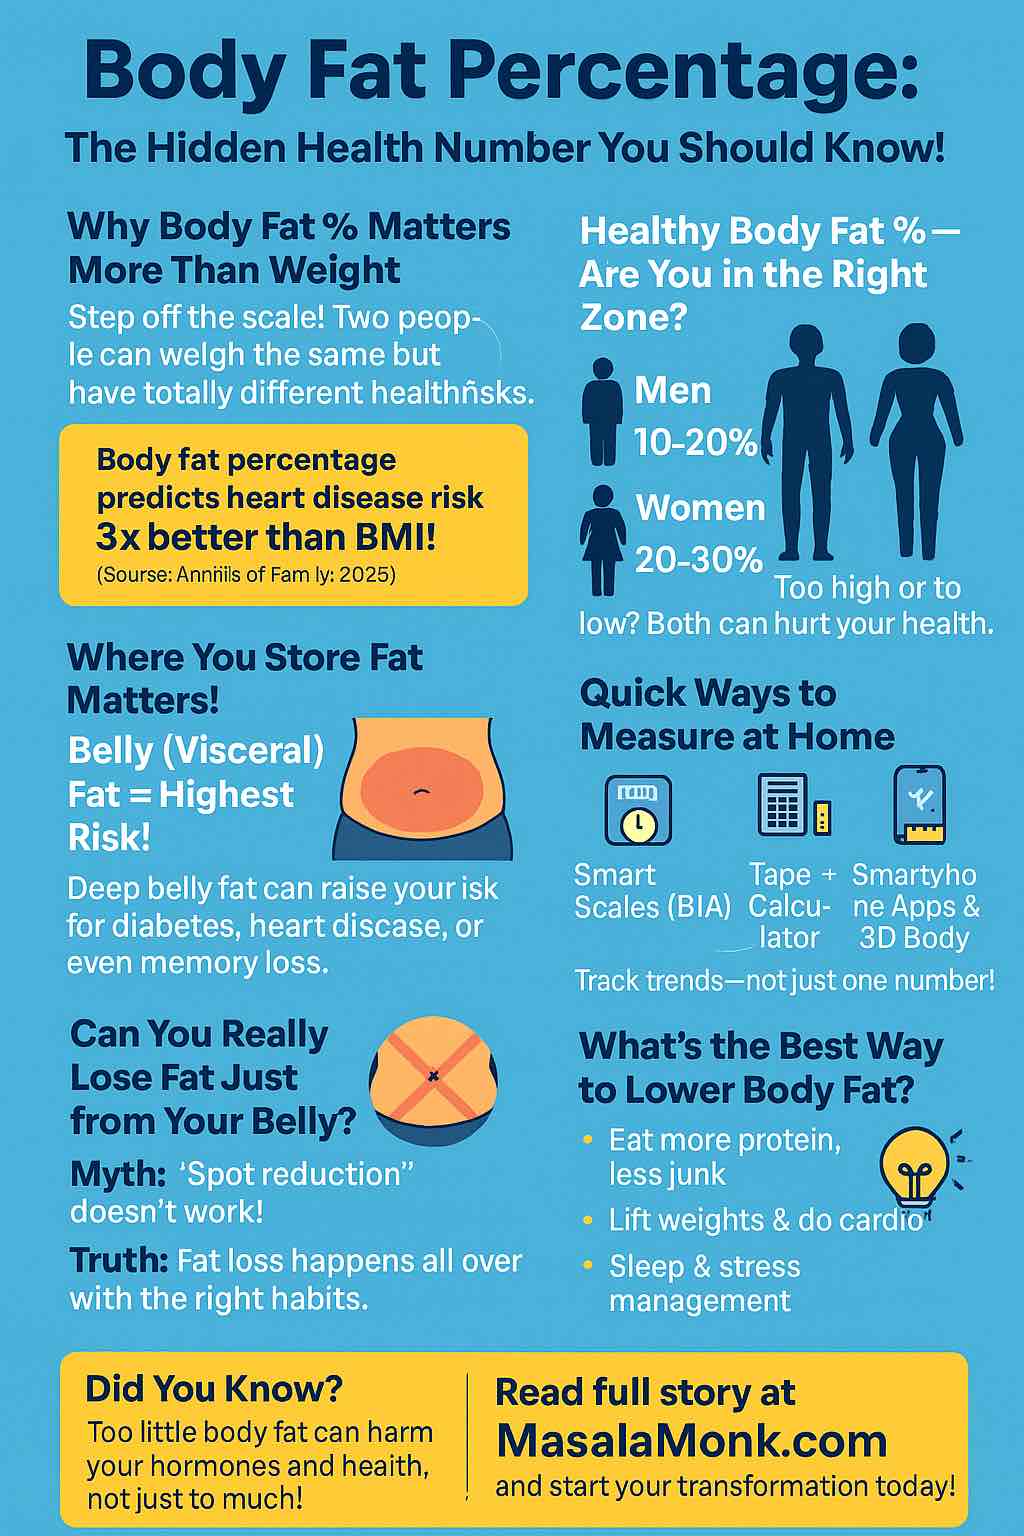
Visceral Fat vs. “Healthy” Readings on a Body Fat Percentage Chart
Visceral fat surrounds the organs and is more strongly associated with metabolic risk than subcutaneous “pinchable” fat. Hence, the WHtR emphasis. Many smart scales display a visceral-fat rating; a common Tanita scheme is 1–12 healthy and 13–59 elevated. Treat it as a trend indicator, not a diagnosis. For specifics, see Tanita’s visceral-fat explainer and device manuals listing the 1–59 scale—e.g., the Tanita MC-780U manual (PDF) and regional healthy living guides.
Making Visceral-Fat Readings Useful
Beforehand, standardise your routine: same time (morning), similar hydration, no heavy meal or hard training right before measuring. Afterwards, log the number and your waist. Thereafter, watch the direction weekly. If waist and WHtR improve while the visceral-fat rating trends down, you are likely heading the right way—even if daily weight bounces.
The RFM Calculator: A Tape-Measure Method that Complements Your Chart
When a clinic scan isn’t available, estimate body-fat in under a minute using RFM (Relative Fat Mass). The equations were proposed and validated against DXA on large datasets: see Scientific Reports 2018 and PubMed. For a friendly research summary, Cedars-Sinai has a concise explainer.
RFM (adults)
- Men:
RFM = 64 − 20 × (height ÷ waist) - Women:
RFM = 76 − 20 × (height ÷ waist)
Use the same units (cm with cm, or inches with inches). Measure the waist at the navel after a normal exhale—no bracing or sucking in. Then, compare your result with the body fat percentage chart above. If you prefer a more structured field method, run the Army/Navy tape approach in our Army Body Fat Standards & Calculator.
RFM for Teens, Coaches, and Parents
Coaching youths? Start with the adult method for simplicity. Then, explore the pediatric extension RFMp in Scientific Reports 2019 and a BMJ Open 2023 application. That said, keep the routine simple and consistent first; complexity can wait until the habit sticks.
How Often to Use RFM (and Why It Works)
Because RFM is low-friction, it’s ideal for weekly or fortnightly check-ins. Pair it with WHtR and you’ll have two strong, complementary signals that track central fat and overall change better than weight alone—see the NHS WHtR calculator and NICE bands. Similarly, if you also own a BIA smart scale, treat those readings as trends rather than single verdicts.
Measuring Body Fat at Home vs. the Most Accurate Clinical Method
For accuracy snapshots, book a DXA scan. DXA estimates total body composition—fat, lean, and bone—and is considered the most practical clinical standard for routine monitoring. Think once or twice a year, not weekly. For a medical explainer, start with Cleveland Clinic’s DXA overview. For services that explicitly offer body-composition DXA, see Cleveland Clinic Canada—Weight & Lifestyle and Movement & Performance.
Choosing an At-Home Method (and Sticking to It)
For week-to-week momentum, pick one method and be consistent. A BIA smart scale can estimate body-fat and report a visceral-fat rating, provided you standardise time and hydration. Alternatively, use RFM for a low-noise, tape-based check. The “best” scale is the one you’ll use reliably under similar conditions. Nevertheless, the most accurate body-composition test remains DXA. Consequently, use DXA quarterly or semi-annually for calibration and rely on RFM/BIA + waist for weekly trends.
What ~16% Looks Like (and a Likely Female “Equivalent”)
Numbers help, but descriptions make them real.
- Men ~16%: clear upper-ab lines, shoulder/arm separation, light forearm vascularity; lower abs may appear in good lighting but won’t remain razor-sharp all day.
- Women ~24%: a visibly defined waist and hip shape, limited ab definition, and an overall athletic silhouette.
Of course, bodies store fat differently—hips vs. belly; thighs vs. back—so appearance varies even at the same percentage. Nevertheless, if your waist trends downward, energy stays steady, and training is consistent, the mirror will follow—even when the scale stalls.
India & South Asia: Body Fat Percentage Chart Guidance and Waist Action Lines
Because South Asian populations show metabolic risk at lower BMI and smaller waists, combine the body fat percentage chart with waist goals. Practical clinic cut-offs used across the region are ≥90 cm (men) and ≥80 cm (women); they’re simple to remember and effective as day-to-day action lines. For a consolidated, peer-reviewed summary, see Obesity in South and Southeast Asia—A New Consensus, with additional regional support in Endocrinology & Metabolism and the URMC review PDF.
Cultural Realities: Make the Diet Fit Your Life
Meanwhile, culture matters: family meals, festivals, and social dinners. Rather than fighting them, work with them. Emphasise protein in staples you genuinely enjoy, add fibre to regular dishes, and keep default snacks simple and predictable. Beyond that, plan automatic meals for busy days so social evenings can flex without blowing your week.
From Chart to Change: A Practical, Sustainable Playbook
Here’s how to turn the body fat percentage chart into progress you can actually feel.
1) Set a Sensible Calorie Target (No Crash Cuts)
Use the RMR Calculator to estimate baseline needs; then create a modest, sustainable deficit. You don’t need an extreme cut to reduce body-fat percentage—you need consistency. In practice, this often means a lean protein anchor, satisfying carbs around training and steps, and fats for taste and satiety.
2) Plan Macros Simply and Repeatably
Most people do better with adequate protein, steady fibre, enough carbs to support movement, and fats for satisfaction. Plug targets into Macro Master. Consequently, build a small roster of meals you genuinely like. For example, aim for 2–3 default breakfasts and 3–4 default lunches that meet your macros with minimal thinking.
3) Lift, Walk, and Add Zone-2
Resistance training 2–4×/week preserves lean mass and improves nutrient partitioning. Daily walking quietly stacks calorie burn and helps manage appetite. Zone-2 cardio builds an engine that taps fat efficiently at sub-threshold effort. If you’re unsure about zones, use the Heart Rate Zone Advisor. If you wear an Apple Watch, Apple shows how to view or edit Heart Rate Zones; for a friendly overview, see Heart Rate Zones & the Apple Watch.
4) Measure Less—but Better
Choose one at-home method (BIA or RFM) plus waist. Log at the same time each week. If possible, schedule an occasional DXA snapshot to verify direction and see distribution—not just totals (start with Cleveland Clinic’s overview and Cleveland Clinic Canada’s services). Crucially, compare like with like: identical lighting, time, hydration, and device settings.
5) Make the Waist Your North Star
Keep WHtR < 0.5 using the NHS calculator. If you’re South Asian, mind the 90/80 cm lines (regional consensus). As your waist comes down, risk generally comes down with it—even before the mirror catches up. Therefore, record waist weekly (after a normal exhale, at the navel) and chart a trend.
6) Build “Automatic” Meals and Rituals
To that end, create friction-free defaults:
- Breakfasts you can assemble half-asleep (e.g., eggs or Greek yogurt + fruit + high-fibre carb).
- Lunches that travel well (e.g., dal + rice + veg + paneer/chicken; or rajma + roti + salad).
- Snacks with protein and fibre (e.g., roasted chana, fruit + nuts, or a simple whey + banana).
Consequently, you’ll have the flexibility for social dinners while staying on track.
7) Expect Plateaus; Plan Micro-Tweaks
When progress stalls, nudge one lever: +1–2k steps/day, slightly smaller portions, or one extra resistance session weekly. Alternatively, tighten weeknight snacking. Conversely, don’t overhaul everything at once; small, targeted changes are easier to sustain and simpler to measure.
8) Track Wins Beyond the Mirror
Better sleep, a lower resting heart rate, higher step counts, and stronger lifts are early green lights. Likewise, improved energy, steadier moods, and fewer afternoon slumps indicate the plan is working. In short, let non-scale wins reassure you while visible changes accrue.
Quick Reference: Tools, Calculators, and Where to Click Next
- Body fat estimation (tape): Army Body Fat Standards & Calculator
- Daily calorie target: RMR Calculator
- Macros & meal planning: Macro Master
- Heart rate zones (training): Heart Rate Zone Advisor and Apple’s support guide
- Waist-to-height ratio: NHS WHtR calculator
- Clinical snapshot: DXA via Cleveland Clinic overview and Cleveland Clinic Canada
Sources Behind the Body Fat Percentage Chart and Guidance
- Body-fat categories: ACE chart; Stony Brook PDF
- Waist-to-height ratio: NHS WHtR calculator; NICE bands & guidance; NICE news
- South/Southeast Asia cut-offs: Consensus (PMC); Endocrinology & Metabolism; URMC review (PDF)
- RFM: Scientific Reports 2018; PubMed; Scientific Reports 2019; BMJ Open 2023; Cedars-Sinai summary
- Visceral-fat rating (BIA): Tanita explainer; Tanita manual (PDF)
- DXA explainer/services: Cleveland Clinic; Cleveland Clinic Canada
Final Takeaway
Start with the body fat percentage chart to orient yourself. Next, take a tape measure and calculate RFM. Then, establish WHtR and aim for < 0.5 (with 90/80 cm action lines for South Asians). For precision snapshots, use DXA; for weekly momentum, rely on RFM/BIA + waist under identical conditions. Finally, turn data into daily behaviors with the RMR Calculator, Macro Master, and Heart Rate Zone Advisor. In the end, your waist will tell the truth: steady habits beat flashy hacks, and the “look” follows the routine.
FAQs
1) What is a body fat percentage chart—and how should I actually use it?
A body fat percentage chart maps common ranges (essential, athletes, fitness, average, obese) so you can quickly orient yourself. However, treat it as a compass, not a courtroom. Moreover, pair your chart position with waist-to-height ratio (WHtR), since central fat (especially visceral fat) predicts risk more strongly than total fat alone. Consequently, take a weekly reading—same time, similar hydration—and watch the trend, not the daily noise.
2) What’s the most accurate way to measure body composition?
Short answer: DXA is the most accurate way to measure body composition for routine use. It estimates fat, lean tissue, and bone. Meanwhile, at home, a multi-frequency BIA body fat percentage scale is great for trends, and RFM (tape-measure method) is a low-noise backup. In short, use DXA occasionally to calibrate and rely on RFM/BIA + waist for weekly momentum.
3) Best at-home body fat measurement: RFM or a scale?
Both can work. RFM needs only a tape and gives a quick bodyfat estimate; it’s perfect if you want a device-free routine. By contrast, a body fat composition scale (ideally multi-frequency BIA) is convenient and logs data automatically. Therefore, pick the method you’ll do consistently and use the same conditions each time.
4) Which is the most accurate body fat percentage scale for home?
Even the most accurate body fat percentage scale at home is still an estimate. That said, multi-frequency BIA models tend to be more repeatable than single-frequency units. Additionally, calibrate your expectations: use the scale as a trend tool and, when possible, cross-check occasionally with DXA.
5) Is there a “best body fat percentage scale” brand (Omron, Tanita, etc.)?
Brand matters less than consistent protocol. For example, Omron and Tanita both offer body scale fat percentage readings via BIA. However, your routine (morning, similar hydration, no hard workout or huge meal right before) will influence accuracy more than the logo. Therefore, choose a reliable device, follow the same steps weekly, and track the direction.
6) How do I measure body fat at home without a scale?
Use RFM (Relative Fat Mass): measure your waist at the navel and your height, then plug into the adult formulas. It’s fast, repeatable, and—importantly—free of device variability. Furthermore, pair RFM with WHtR for a clearer picture of central fat. For structure, you can also compare with the tape method in our Army Body Fat Standards & Calculator.
7) What’s the best way to measure body fat percentage every week?
Practically, choose one at-home method (RFM or a body fat measuring scale) plus a waist reading. Then, measure at the same time each week. Moreover, log steps, training sessions, and sleep—because these behaviors explain changes in your readings. Ultimately, consistent methods beat fancy gadgets used sporadically.
8) How do I lower my body fat percentage—safely and sustainably?
Focus on repeatable basics: a modest calorie deficit, protein-forward meals, steady fiber, resistance training 2–4×/week, daily walking, and Zone-2 cardio. Meanwhile, avoid extreme cuts promising the fastest way to reduce body fat percentage—they usually sacrifice performance and rebound later. Consequently, use the RMR Calculator to set targets and Macro Master to plan meals you’ll actually enjoy.
9) Female-specific: what’s the best way to reduce body fat percentage for women?
Women typically benefit from adequate protein (roughly 1.6–2.2 g/kg), 2–4 days of strength training, 7k–10k steps, and consistent sleep. Additionally, expect normal fluctuations across the menstrual cycle; therefore, judge progress by weeks, not days. In short, prioritize habits you can maintain, and pair your routine with a body fat percentage chart and WHtR for context.
10) I’m South Asian. Do I need different targets?
Often yes. Notably, metabolic risk can appear at smaller waists in South Asian populations. Consequently, action lines of ≈90 cm (men) and ≈80 cm (women) are widely used. Moreover, keep WHtR < 0.5 as a simple, universal goal. Practically, pair these waist targets with your spot on the body fat percentage chart for day-to-day decisions.
11) What is a visceral fat measurement scale—and how do I use it?
Many smart scales show a visceral fat measurement scale or “rating.” However, treat it as a trend indicator, not a diagnosis. Meanwhile, to make it useful, standardize your routine (morning, similar hydration), log the rating and your waist, and evaluate the direction monthly. If both visceral rating and WHtR improve, you’re likely reducing central fat.
12) What’s the most accurate way to measure body fat at home if I can’t get DXA?
Realistically, combine a multi-frequency BIA scale with waist and RFM. Moreover, stick to a consistent protocol and compare like-with-like every week. On balance, this “triangle” (BIA + RFM + waist) is the best at home body fat measurement approach for most people.
13) Is there a body fat percentage weight loss calculator I can use?
Yes—use a simple weight loss percentage calculator alongside your chart:
Weight-loss % = (Starting weight − Current weight) ÷ Starting weight × 100.
Additionally, pair it with RFM or a body fat percentage scale so you track composition, not just the scale. Consequently, you’ll celebrate fat loss even when body weight stalls.
14) What’s the quickest way to lower body fat percentage—really?
Honestly, there’s no magic. Nevertheless, the quickest way is often the most consistent way: set a modest deficit, hit protein, lift 2–4×/week, walk daily, and add Zone-2. Furthermore, pre-plan “automatic meals” for busy days to avoid impulsive choices. In short, small wins stacked daily beat heroic bursts that fizz out.
15) How often should I get a professional body fat measurement?
If available, do DXA 1–2× per year. Meanwhile, between scans, rely on RFM/BIA + waist. Moreover, if you switch clinics, ask for the same machine model and protocol, because measurement drift can obscure progress.
16) Are smart-camera or app-based measurements (e.g., “photo body fat”) reliable?
Sometimes they’re decent for trends; however, they can vary by lighting, pose, and camera. Therefore, use them sparingly and confirm direction with waist, RFM, or a body fat percentage scale. If the ecosystem is discontinued, you’ll still have your tape-measure routine to fall back on.
17) Should I aim to “lose 10 percent body fat” as my goal?
Maybe—but context matters. For some, −10% body fat is a long, multi-phase project. Consequently, break the journey into smaller milestones (e.g., improve WHtR to <0.5, trim 2–4 cm off the waist, or add 2 reps to key lifts). Meanwhile, celebrate non-scale wins: better sleep, lower resting HR, steadier energy.
18) Best way to measure body fat percentage at home vs. best body fat test overall?
At home, the best way to measure body fat percentage is the method you’ll repeat correctly: RFM or a BIA body fat index scale, plus waist. Overall, the best body fat test for accuracy remains DXA. Therefore, use each where it shines: DXA for snapshots; RFM/BIA + waist for weekly guidance.
19) Do I need a special diet to lower body fat percentage fast?
Not necessarily. Moreover, “special” often means restrictive. Instead, use Macro Master to set simple macros, build 2–3 breakfasts and 3–4 lunches you enjoy, and keep snacks predictable. Consequently, you’ll maintain your deficit without white-knuckle willpower.
20) Where should I start—today?
Start here:
- Take waist and height; calculate WHtR (<0.5 target).
- Measure RFM or step on your body fat percentage scale.
- Set calories via the RMR Calculator and plan meals in Macro Master.
- Schedule 2–4 strength sessions and daily steps; add Zone-2.
- Recheck weekly; celebrate non-scale wins. In short, stay consistent and let the trend tell the truth.